
Document Type : Original Article
Authors
1 Department of Environmental and Sanitary Engineering, Faculty of Civil Engineering, Damascus University, Damascus, Syria
2 Department of Horticultural Sciences, Faculty of Agricultural Engineering, Al-Baath University, Homs, Syria
3 Department of Horticultural Sciences, University College of Agriculture and Natural Resources, University of Tehran, Iran
Abstract
Keywords
The importance of studying the effect of temporal and spatial changes on river water quality comes from the increasingly urgent need for freshwater [1]. Human activities are the primary cause of the chemical pollution of water resources [2]. The various emissions which are directly or indirectly discharged into water bodies lead to the contamination of rivers with industrial [3], domestic and agricultural wastes, which poses a serious threat to human health, wildlife, and aquatic life, as well as their impact on the stability of the ecosystem. Hence, these sources must be subject to continuous quantitative and qualitative monitoring to reduce the risks of pollution [4].
Orontes River is considered one of the important water resources in the Eastern Mediterranean region, as it is a main source of water for human, agricultural, and industrial uses in the area [5]. In a study to assess the water quality of the Turkish section of Orontes River basin [6], the effects of temporal and spatial changes on a set of 16 indicators were investigated using statistical analysis techniques during the period 2004-2014. The results obtained using factor and discriminate analysis indicated that the most important variables responsible for water quality changes are Na, Mg, Ca, biological oxygen demand (BOD), flowrate (Q), NH4, and suspended solids (SS). Therefore, mineral pollution, nutrient pollution, and organic pollution are the underlying factors affecting water quality.
The use of statistical methods with the collected environmental data is necessary in order to find accurate and logical scientific explanations of phenomena [7-9]. Studies that rely on environmental statistical analysis have become one of the tools used in identifying sources of pollution and facilitating water resources management [10][11]. Due to the scarce statistical studies in the Central Orontes River basin, this research aims to determine the main indicators that affect water quality in this area considering the spatial and temporal changes using variance analysis. The study also aims to establish an initial classification of water at a specific point or time, which assesses reducing the number of samples, time, effort, and cost of analysis in future studies.
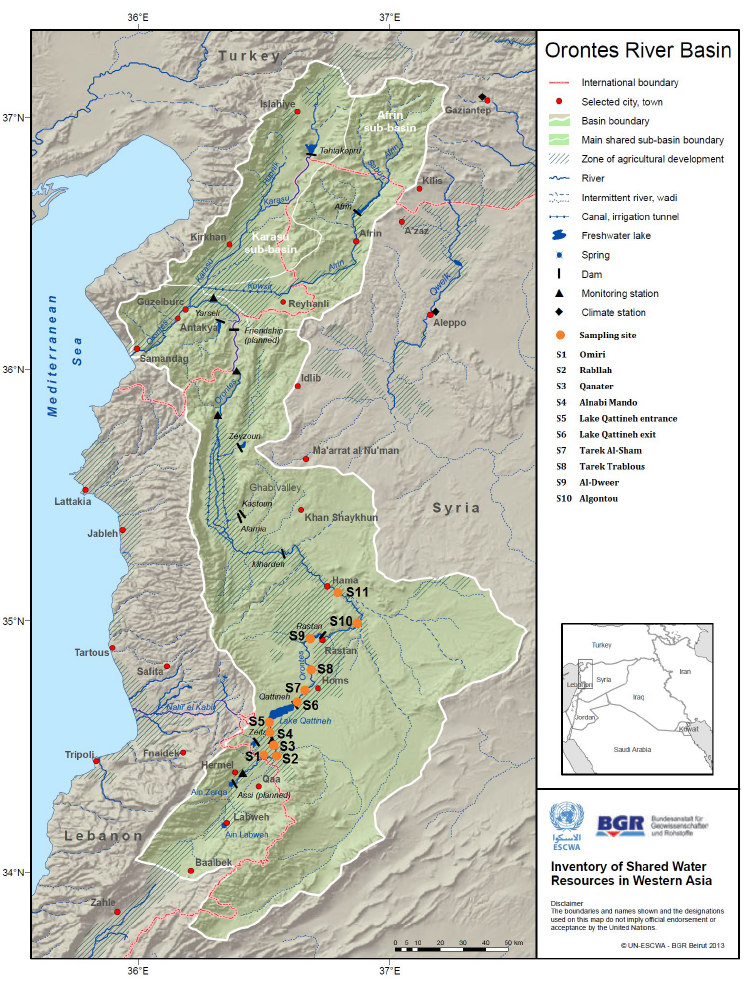
The Orontes River begins in Al-Bekaa Valley in Lebanon from different groups of sources (Ain Zarqa, Hermel, and Shoghir springs) from the West Lebanon Mountains, and (Ras Baalbek, Al-Labwa, and Ain Falaki springs) from the eastern Lebanon Mountains; then, it enters the Syrian lands at Al-Amiri Observatory [12]. Its flow system is rain-fed and supplies water to a basin with an area of 24000 km2. It is considered the main source of water for most activities in the area, as about 12 million m3 is extracted annually for different purposes [12], and it is a major source of drinking water for Homs and Hama cities. Its total basin area is estimated to be 26,530 km2, 67% of which is located in Syria [13] (Fig. 1).
This research concentrates on the central region of Orontes river, which is exposed to a group of pollutants resulting from the effluents of informal settlements, and industrial facilities in the region, such as Homs refinery, the general fertilizer company, in addition to the sugar and dairy factory
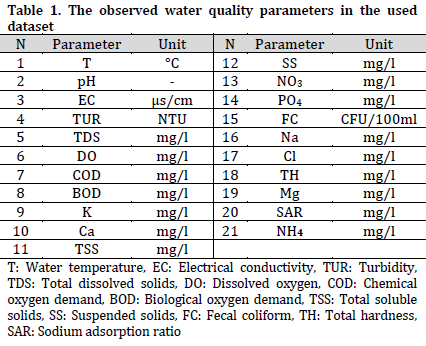
The data used in this research was provided by the environmental and water resources directorates in Homs. This dataset is constituted of 21 chemical and physical parameters (Table 1) of water samples acquired once a month from 11 monitoring points along the central region of Orontes River (Fig. 1) between 2010 and 2020.
The analysis of variance is a common tool in water studies [14-18]. It represents a linear relationship between one or more dependent variables and one or more independent variables, the number of both determines the type of variance analysis.
Types of Variance Analysis:
1) Univariate analysis (ANOVA): One dependent variable and one independent variable.
2) Multiple variance analysis (MANOVA): there are more than one dependent variable and one or more independent variables. Depending on the number of independent variables, it is determined whether it is in one direction, two directions, or “N” directions.
3) Covariance analysis (ANCOVA): It expresses the relationship between one or more dependent variables and one or more independent variables, excluding the effect of the control variables (covariates). 4) Multivariate analysis of covariance (MANCOVA): It expresses the relationship between more than one dependent variable and one or more independent variables.
4) Multivariate analysis of covariance (MANCOVA): It expresses the relationship between more than one dependent variable and one or more independent variables.
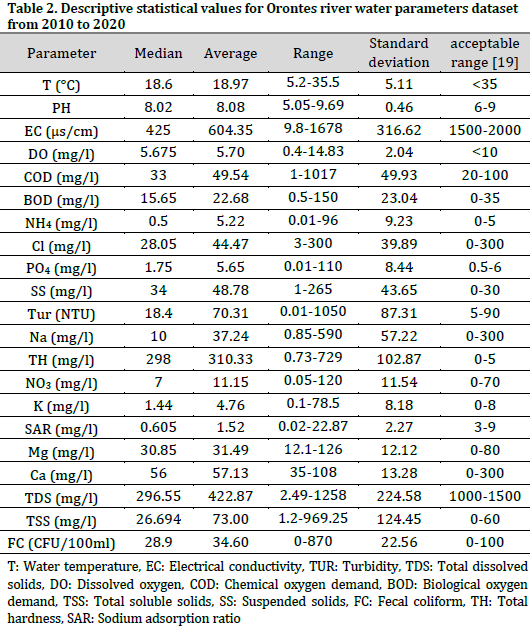
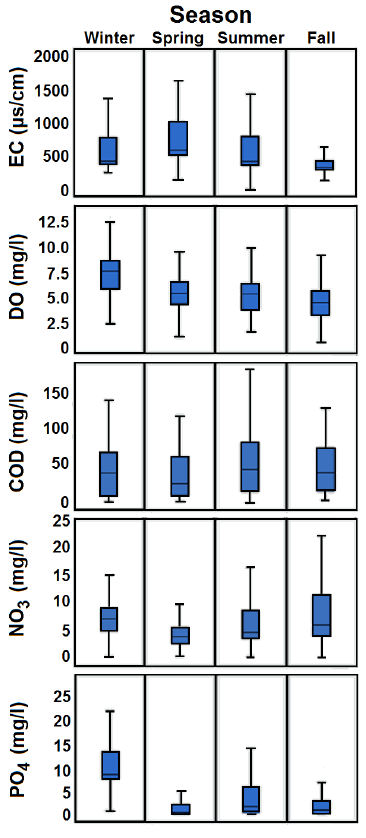
The data taken from the monitoring stations were analyzed using the SPSS 25 and Excel and box plots were used to show the seasonal effects on EC, DO, COD, NO3, and PO4. the anomalies were removed and the basic descriptive statistical values of the parameters were calculated between 2010 and 2020
The basic descriptive values in the used dataset showed that most of the studied parameters are within the acceptable range on average according to the Syrian Standards Specifications [19] (Table 2). However, seasonal box plots showed a notable increase in COD accompanied by a decrease in dissolved oxygen in fall and summer compared to spring and winter (Fig. 2), indicating drainage pollution (especially industrial drainage) during summer and fall.
Multiple variance analysis MANOVA was applied in ‘N’ direction with seasons or observation sites being considered independent variables and pollution indicators as dependent variables. This analysis was employed to study the effect of the temporal changes on the variables independently regardless of mutual effects between the independent and dependent variables (Table 3).
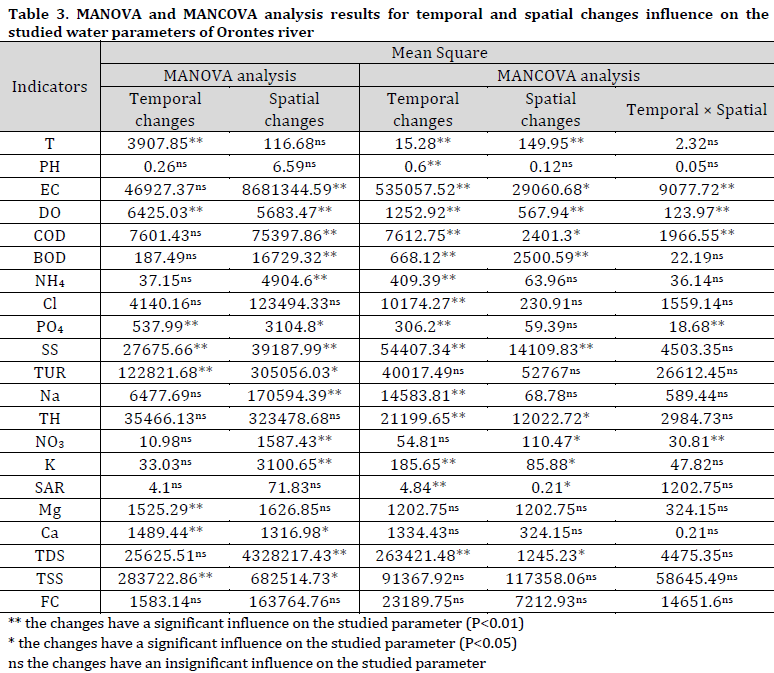
MANOVA analysis showed that T, DO, PO4, SS, TUR, TSS, TH, Mg, and Ca were significantly influenced by seasonal changes, which is similar to the results of [20] where many water quality variables were influenced by seasonal variations.
As for the spatial effect, MANOVA analysis showed that EC, DO, COD, BOD, NH4, PO4, SS, TUR, Na, NO3, K, Ca, TSS, and TDS were significantly affected by location. This observation indicates that there is a clear effect of sanitation, industrial, and tourist facilities in changing the indicators along Orontes River.
Multivariate analysis of covariance MANCOVA was applied to the data, where seasons or observation sites were considered independent variables and pollution indicators as dependent variables taking into consideration the reciprocal effect (Table 3).
The results showed that T, pH, EC, DO, COD, BOD, NH4, Cl, PO4, SS, Na, TH, K, SAR, TDS were affected by season changes with reciprocal effects between the indicators. On the other hand, spatial changes significantly influenced T, EC, DO, COD, BOD, SS, TH, NO3, K, SAR, TDS taking into consideration the reciprocal effects between the indicators.
MANCOVA was then utilized to investigate the interaction between temporal and spatial changes (Table 3). The results showed that this interaction significantly influenced EC, DO, COD, NO3, and PO4. By comparing the results of the interaction between temporal and spatial changes with other simple analysis results, it is noticed that the influenced parameters are limited to the five aforementioned variables, which is similar to the previously obtained results [21] using other analytical method (weighted arithmetic mean).Therefore, these five parameters can be considered as a reduced indicator to assess pollution in the main Orontes basin.
Determining the quality of surface water has become an important focus of contemporary research due to the problems arising from the diminishing amount of freshwater resources. The current results showed that the EC, DO, COD, NO3, PO4 were the main water parameters influenced by seasonal (temporal) and location changes interaction in the main Orontes river basin. Therefore, some areas are greatly affected by industrial water drainage, while other areas are influenced by agricultural activities. The research highlights the importance of conducting statistical studies on the studied areas, including lakes and groundwater, in order to monitor water quality, evaluate pollution management policies and tracing the movement of pollutants along the river.
Conflict of interest statement
The authors declared no conflict of interest.
Funding statement
The authors declared that no funding was received in relation to this manuscript.
Data availability statement
The authors declared that the used dataset can be obtained from the corresponding author upon reasonable request.
)