

Document Type : Original Article
Authors
1 Department of Agricultural Machinery Engineering, Faculty of Agricultural Engineering and Technology, University of Tehran, Iran
2 Department of Mechanical Engineering of Agricultural Machinery, Faculty of Mechanical Engineering, University of Aleppo, Syria
3 Department of Horticultural Sciences, University College of Agriculture and Natural Resources, University of Tehran, Iran
4 Department of Horticulture, Faculty of Agricultural Engineering, Al-Baath University, Homs, Syria
Abstract
Keywords
The measurement of crops’ external color during different ripening stages before harvest is a substantial harvest indicator. Additionally, monitoring color changes during the storage period is an essential task in postharvest research. In melon fruit postharvest research, monitoring rind color changes is crucial since it is not only an indicator of postharvest performance [1][2], but also the primary method of assessing chilling injury during cold storage [3]. However, monitoring color and color changes during melons’ storage period using on-bench chromameters is not an easy task. Melons are usually large in size; therefore, various reads should be recorded to increase accuracy.
Recently, the use of image analysis knowledge has been expanding in various fields of science, especially in the food industry and agricultural applications. Image analysis is identified as any form of processing image as an input signal, and the output of this procedure can be an altered image or a set of special symbols or variables that describe the data in the original image (i.e., color features). Most image analysis methods are carried out by handling the input image as a two-dimensional signal and applying the required processing techniques [4]. The images that a digital camera receives are made up of tiny square dots, each of which has a specific color. When these dots are placed next to each other, they form an image. These points are called pixels, which are the smallest element of a digital image. It should be noted that the numerical value of each pixel represents the amount of light emitted from this object and received by the camera.
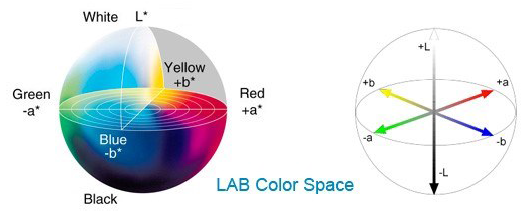
In general, the color model is the determination of three-dimensional parameters. The purpose of using a color model (color space) is to standardize color expression. The most common color spaces are RGB, XYZ, HSV, HSL, and CIELAB [5]. CIELAB color model was introduced in 1967 by the CIE International Lighting Association. In the CIELAB color space, colors are defined by three parameters, which are the amount of brightness denoted by L*, the amount of color from green to red denoted by a*, and the amount of color from blue to yellow denoted by b*. L* ranges from 0 to 100, where 0 indicates black and 100 indicates white. While, the range of a* is from -127 (green) to +127 (red) and b* range is from -127 (blue) to 127+ (yellow) (Fig. 1). The advantage of CIELAB color space over other color modes is that the grayscale information (expressed by L* values) is separable from the color information (expressed by a* and b* values). Therefore, this color space is widely used in the colorimetric design of printers, cameras, and scanners [5].
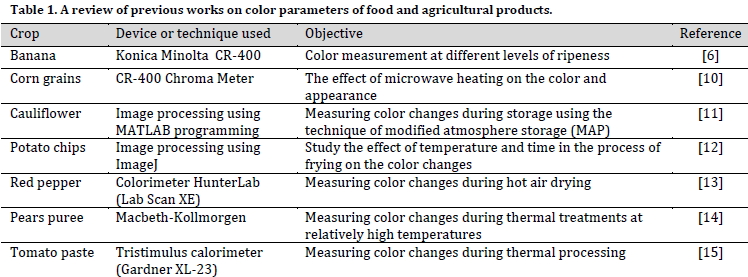
Due to its various advantages, CIELAB is the most widely used model in food and agricultural applications (Table 1). The values of color parameters (i.e., L*, a*, and b*) are usually determined using commercially standard chromometers devices [7][8]. Overall, These chromometers devices calculate the distribution of the spectrum when transmitted or reflected across the sample [9]. However, these instruments are expensive and may not be available in some universities and scientific centers. Furthermore, the size and constant need for calibration render some types of these devices unfit for field use.
The aim of this study is to develop a portable and unexpensive system as an alternative device to the commercially available standard chromameter instruments for the measurement of color parameters of melon rind based on the image analysis method. Furthermore, taking into consideration that chromameter results are expressed as the average values of few chosen points, these results may be inaccurate when representing the whole surface color of a large fruit such as melon. Thus, and considering the importance of evaluating the full surface of melon fruit during postharvest period, this study aims to evaluate the developed system accuracy in measuring rind color changes during cold storage period in melon. The designed device should also be suitable for use in both the laboratory and field.
In this study, a portable and cheap imaging system was developed to measure the rind color of different melon genotypes at harvest and after cold storage for a month. Additionally, color changes in melon rind were measured by the proposed device. The designed system consisted of two parts, hardware and software. The hardware part included an imaging box, an artificial lighting system, and a smartphone for image obtaining. An image analysis software was utilized to process the acquired images and extract the values of color components from the melon rind. The proposed color measurement system was evaluated by comparing the extracted color values with a standard color measurement device.
In this research, a ready-made ionolite cold box with 500× 400× 500 mm dimensions was selected as the imaging box. The reason for choosing this material is that it is available in abundance, lightweight, and cheap. The interior color of the box was white, which allows the even distribution of light inside the box. The upper inner surface of the box was supplied with an artificial lighting system consists of 1 m of light-emitting diode (LED) lamp. A small circular aperture with a diameter of 3 cm was carved at the middle of the top wall to install a camera. In the proposed system, A mobile phone with a 13-megapixel CMOS digital camera with Sony IMX214 Exmor RS sensor was utilized. A black cardboard sheet was placed on the bottom base of the imaging box to increase the contrast between the object and the background in the captured image. The goal is to increase the accuracy of separating the object from its background by the image analysis software to extract only the color features (color components values) associated with the melon sample. (Fig. 2) shows an overview of the proposed system.
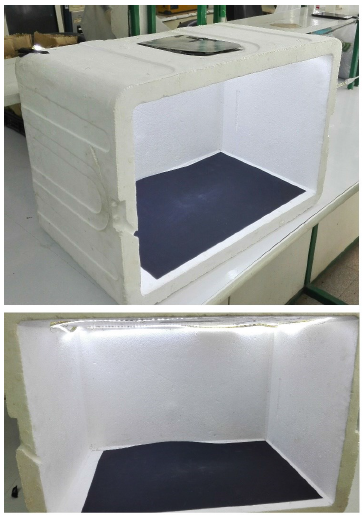
For imaging, the lighting system was turned on. The melon sample was mounted on the cardboard sheet under the mobile phones’ camera. Then, the door of the ionolite cold box was closed to eliminate the effects of external light sources and to obtain images without noise. After capturing, the acquired images were directly saved with specific labels. The images were taken with JPG format and a resolution of 4160 x 3120. It is worth noting that, to ensure the equality of conditions affecting the captured images, the intensity of the used lighting system and all the settings of the utilized camera were constant during the imaging period of the samples.
In the next step, ImageJ (National Institutes of Health, United States) [16] was used as an image processing software to analyze the acquired images and extract the color values of the captured images in RGB color space.
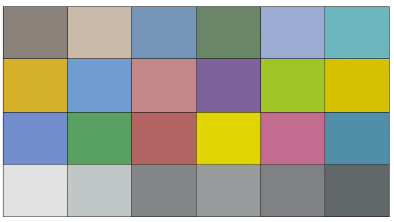
A standard color chart of 24 color patches (Fig. 3) was used in standardizing the used camera. First, the values of color components were recorded in CIELAB color space for all the color patches using a standard chromameter device (Model: CR-400 Konica Minolta, Japan). Then, the standard color chart photo was captured using the imaging box. The obtained image for the color chart was processed using ImageJ processing software, and the average color components values in RGB color space of each color patch were extracted. After that, the RGB reads (i.e., R, G, and B value) were converted directly to CIELAB units (i.e., L*, a*, and b* value) using ColorMine library [17], which depends on the three-stage method explained in detail by [18].
To find the relationship between the standard and the measured CIELAB color values related to the 24 patches of the color chart, the regression between chromameter data and imaging box data was analyzed using Minitab 19 software (Pennsylvania State University, United States) using all the possible term combinations. Finally, the regression models with the best fit were chosen using the forward information criteria method to predict chromameter values based on measured values using the proposed system.
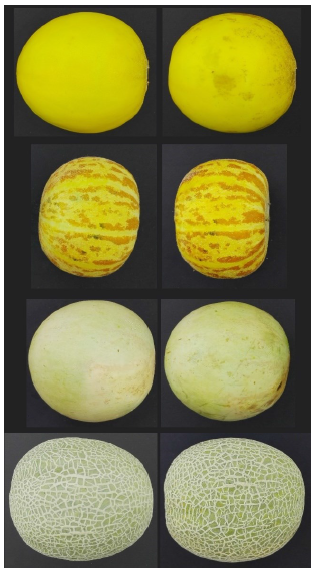
For the evaluation of the developed color measurement system, the fruits of 36 different melon (Cucumis melo) genotypes were used. The genotypes were previously reported in [19]. Melon fruits were stored at 4 °C for one month. (Fig. 4) represents samples of the capture images for the studied genotypes before and after cold storage period. Color components values of melon rind were recorded in CIELAB color space as an average of 5 reads of CR-400 Konica Minolta chromameter evenly distributed on fruit surface at day 0 (at harvest) and after 30 days in cold storage (for the same fruit). The images of the same melon samples were captured using the proposed imaging box at harvest and after the storage period, and the obtained images were processed using ImageJ software to extract the average RGB values of the entire surface of the sample. The results obtained from image processing (i.e., R, G, and B values) were converted to CIELAB color space (i.e., L*, a*, and b*) using the method mentioned above. Then, CIELAB values were adjusted according to the selected regression model. The results before and after adjustments were compared to the results obtained by chromameter using Mann–Whitney test with Minitab software. Furthermore, The total color changes during storage period were calculated using CIEDE2000 color-difference formula [20] Eq. (1).
![]()
where L0*, a0* and b0* are the values of color parameters at harvest, and L*, a* and b* are the values of color parameters after cold storage.
The average color changes results calculated from the standard chromameter were compared with those obtained from image processing before and after adjustment using Mann–Whitney test.
To obtain the relationship between the actual (standard) CIELAB units related to all 24 color patches and those measured by the imaging system, a multivariate linear regression (MLR) correlation for each color component (i.e., L*, a*, and b*) was extracted. Regression analysis results showed a high correlation for all three parameters. The coefficient of determination (R2) for the selected regression models were 93.1%, 99.5%, and 99.9% for L*, a*, and b*, respectively. Although R2 refers to the model as a good describer of the data, a high R2 value (R2>0.8) does not necessarily mean that the model is appropriate [21]. Therefore, R2 results were compared with the predicted R2 values. Comparison results showed no substantial differences between the R2 and the predicted R2 for any of the selected MLR models (Table 2). This observation indicates that the obtained correlation equations are generalizable with high accuracy. Thus, the chosen models could accurately predict the variables in demand. The obtained MLR correlations for each color component with its R2 and predicted R2 values were listed in Table 2.

As shown in (Table 2), Only L* and a* values of the processed images contributed to the prediction model of L* chromameter value. However, all three components (L*, a*, and b* values) of the processed images contributed significantly to the prediction model of a* and b* chromameter values. The aforementioned formulas (MLR correlation) were used to adjust melon fruit image processing results.
In addition to measuring and comparing the actual and the predicted color values (i.e., L*, a*, and b*), the total rind color changes resulting from storage were also measured by the proposed system and then compared with the chromameter values. Consequently, the results related to color parameters (i.e., L*, a*, and b*) and color change parameter (ΔC) for Melon rind were obtained from image processing. After that, these results were compared to those of chromameter before and after applying the adjustments (using the obtained MLR correlation) using Mann–Whitney test. The statistical analysis results of this comparison are presented in (Table 3).

As it is evident in (Table 3), the total color changes values (ΔE00) between non-adjusted results and chromameter results were substantially higher than those between adjusted image processing results and chromameter reads. This divergence was mainly due to L* differences since a significant difference was observed in L* values between raw image results (before adjustment) and chromameter results. Given that the value of L* is related to the brightness in the acquired image, these differences can be explained by the high intensity of the used light source. However, there were no significant differences in a* and b* values between the raw results and chromameter results. On the other hand, no significant differences were observed in any of the color values (L*, a*, or b*) between images adjusted values and the chromameter results.
As for color changes throughout the storage period (ΔC), there were no significant differences between either image data (raw and adjusted) and chromameter data (Table 3). This result indicates no need for image processing data adjustment when the main goal is to calculate color changes. This finding is highly valuable, especially in postharvest research where measuring color differences for the same sample over a period of time is of high importance. The main advantage of image processing data here is to measure color changes for the whole surface of the sample compared to chromameter, where only a few points are chosen to represent the total surface of the fruit.
Various studies have been carried out to develop color measurement systems for agricultural and food products using image processing techniques. [22] developed a computer vision system based on image processing toolbox in MATLAB software. This system consisted of a digital camera, a controlled illumination environment, and a software package to process the images. In the aforementioned study, the color of 40 samples of raw and processed foods was measured in the CIELAB color space with the computer vision system and traditional chromameter. The results showed that L*, a* and b* values were equivalent between both techniques for most samples. However, they mentioned that the total color changes difference (∆Ε) for 37 of 40 samples was greater than 2. They described these differences as “high enough to be noticeable”, and thus, the systems are not equivalent in measuring the real color changes [22]. The advantage of our proposed system was that no significant differences in the total color changes were noticed between the results obtained by image processing and those of standard chromameter (Table 3).
In the current study, a portable and inexpensive system based on image processing techniques was developed for measuring the color parameters of melon fruit. The results showed that the developed system could be used efficiently according to the proposed color adjustment method to monitor fruit color at harvest and during storage period. Additionally, there is no need to adjust color changes values when the main goal is to calculate color differences. This finding is highly valuable, especially in postharvest research where measuring color differences for the same sample over a period of time is of high importance. However, it was concluded that the amount of L* parameter measured in the proposed system is very high compared to the standard chromameter device. This observation might be the result of high light intensity within the system. Therefore, some modifications might be suggested here, such as adding a light intensity adjuster (dimmer).
Conflict of interest statement
The authors declared no conflict of interest.
Funding statement
The authors declared that no funding was received in relation to this manuscript.
Data availability statement
The authors declared that all related data are included in the article.