
Document Type : Original Article
Authors
1 Department of Horticultural Sciences, University College of Agriculture and Natural Resources, University of Tehran, Iran
2 Department of Horticulture, Faculty of Agricultural Engineering, Al-Baath University, Homs, Syria
Abstract
Keywords
Walnut is one of the main horticultural crops in Iran, and the country is ranked third in terms of production after China and the USA, with a production rate of 356.7 tonnes [1]. However, fungal diseases, especially anthracnose and blight, constitute a major loss in walnut orchards, which may have a disastrous economic impact. The main causative agent of nut anthracnose is the fungus Gnomonia leptostyla and its asexual form Marssonina juglandis [2]. Anthracnose is considered one of the most threatening diseases for walnut orchards worldwide and in Mediterranean countries in particular [3]. This fungus spreads easily in the walnut orchards via wind or rainwater and attacks all tree parts, including leaves, fruits, shoots, and buds. The infection begins in the form of circular spots of dark brown color that, with the progression of the infection, merge to form sunken necrotic spots [4]. After that, it severely damages the leaves, which negatively affects the efficiency of photosynthesis and in the advanced stages leads to leaf fall and a decrease in the quality of the fruits, and may result in the overall weakness and death of trees in severe infections [2-6].
The bacterium Xanthomonas arboricola pv. juglandis causes walnut blight disease [7]. The blight can attack all tree tissues, including catkin, female flowers, buds, shoots, leaves, and fruits. This disease causes heavy losses in walnut orchards worldwide, especially in wet years [8]. Considering the significant losses caused by anthracnose and blight, estimating genotypes’ resistance to these two diseases is among the primary goals of any walnut breeding program.
The conventional estimation of plant disease severity by visual screening is a laborious task. This evaluation requires long hours of inspection by skilled experts to generate reliable results. Therefore, automating this task is highly important in plant protection research and large germplasm evaluation. For this purpose, several image processing techniques are being employed. For instance, color segmentation was proven highly efficient in this area [9]. Image segmentation is the process where different regions of the image are classified and clustered based on a simple thresholding function or more elaborate algorithm. Then, the segmented image is masked for further analysis or processing. In fact, numerous works employed image segmentation to detect and estimate the severity of plant disease [10-12]. Therefore, this study aimed to develop an automated anthracnose and blight severity estimation by utilizing image segmentation approach. Furthermore, this study aims to compare the developed system results with visual screening.
In this research, approximately 130 walnut trees grown at the Research Station of the Department of Horticultural Sciences, University of Tehran, were visually evaluated to determine their tolerance to anthracnose and blight. The leaf samples were collected randomly at a rate of 15 per genotype. The severity of infection in each sample was estimated based on visual screening. Then, the combined disease severity (for anthracnose and blight) was expressed as a percentage for each leaf.
The images of all visually inspected leaf samples across the studied genotypes were acquired with a 13-megapixel digital camera under constant lighting conditions.
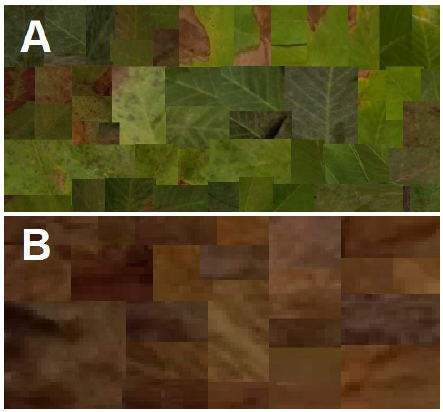
In order to generate a binary mask of the total leaf area, the leaf’s background was omitted via a simple mono-color threshold function, and all holes were filled using image processing toolbox in Matlab R2021a. The total leaf region was measured using the binary mask. Approximately 50 representative samples of leaves (Fig. 1 A) and infected regions (Fig. 1 B) were arranged in a collage to generate the color thresholds for the image segmentation function using Matlab’s color thresholder app. For this task Lab color space was chosen. The exported function was used to generate an infected area estimation using the following formula automatically:
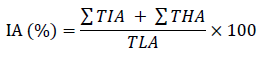
Where
IA is the estimated infection area (%)
∑TIA is the total infected area in pixels
∑THA is the total holes and losses area in pixels
TLA is the total leaf area in pixels (including healthy areas, infected areas, and leaf holes/losses)
The segmentation function estimates of each sample and each genotype (as an average) were compared to their visualized counterparts with two-tailed Pearson’s correlation coefficient and regression.
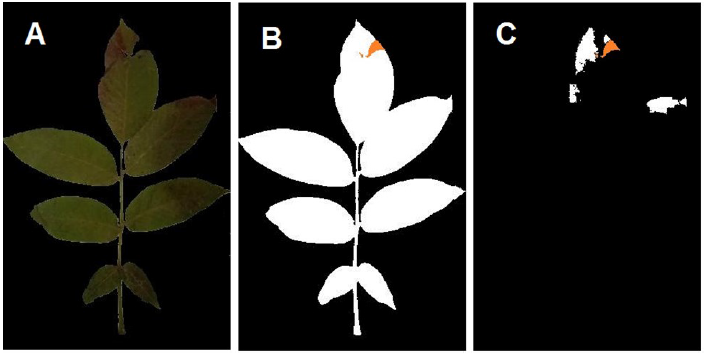
The channel thresholds of the segmentation function were defined manually based on the presented arrangement (Fig. 1) in Lab color space on the images with omitted backgrounds (Fig. 2 A). The optimized thresholds were 4.015 to 47.209, 5.314 to 19.579, and 4.289 to 33.699 for L, a*, and b* channels, respectively. The image fill function was employed to fill the holes and losses caused by the studied disease. Binary masks for the total leaf area (Fig. 2 B) and the infected areas (Fig. 2 C) were generated, and the aggregated areas of each mask were measured to calculate the estimated infection percentile.
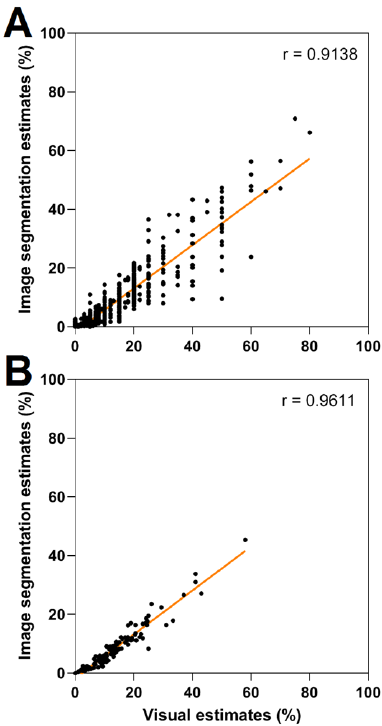
The validation of image processing techniques is usually carried out by comparing its results with actual results. These actual results might be visual inspection (expert inspections) [13] or manual image analysis [14]. The chosen actual values are then compared with image processing values via correlation (r) and regression (R2), which usually fall within the range of 0.7-1 in similar tasks [15]. Correlation and regression analysis showed that visual estimations were strongly correlated with their image segmentation counterparts with values of r = 0.91 (R2 = 0.83) (Fig. 3 A) and r = 0.96 (R2 = 0.92) (Fig. 3 B) for individual samples and genotype averages, respectively. Therefore, both values are comparable to previous works in the field [10]. Thus, the proposed system can be a reliable automated substitute for expert evaluation.
Previous research showed that other color spaces, such as HSV, outperformed Lab in color segmentation tasks [16]. However, the current work showed that Lab handled the studied problem adequately, corresponding to other research with similar tasks [17]. This observation might be due to the high flexibility of Lab in distinguishing between the brown (infected) and green (healthy) regions. The proposed system could only estimate the severity of both diseases (Anthracnose and blight) combined due to the high similarities between the two infections in terms of color. Therefore, a more elaborate system is needed to differentiate between the two diseases. Furthermore, the background isolation was feasible through simple color segmentation since images were acquired under lab conditions, with constant light intensity and mono-color background. Therefore, enhancing the system’s capability to handle noisy backgrounds might be an interesting goal. Both enhancements can be achieved through deep learning techniques and would render the system capable of carrying out reliable real-time field estimations of each disease individually.
Conflict of interest statement
The authors declared no conflict of interest.
Funding statement
The authors declared that no funding was received in relation to this manuscript.
Data availability statement
The codes and datasets used and developed in this article are available from the corresponding author upon reasonable request.
)